
Amongst dialogues of vaccination programmes, prospective travel bubbles, and further easing of restrictions; it’s hard to believe that it’s been over one year since the initial discourse of the pandemic.
To unfold the impact of COVID-19 and, more importantly, the path the pandemic has paved for hospitality moving forward, we’ve analysed a year’s worth of industry data.
In this report, we look at venues that were trading with Lightspeed throughout the pandemic across Australia and Auckland, New Zealand.
The shape of 2020
April 2020 was undoubtedly the toughest month for hospitality as a whole. It took three months of drastic pivoting for most venues to return to pre-COVID numbers – which fluctuated again during the second wave in August 2020.
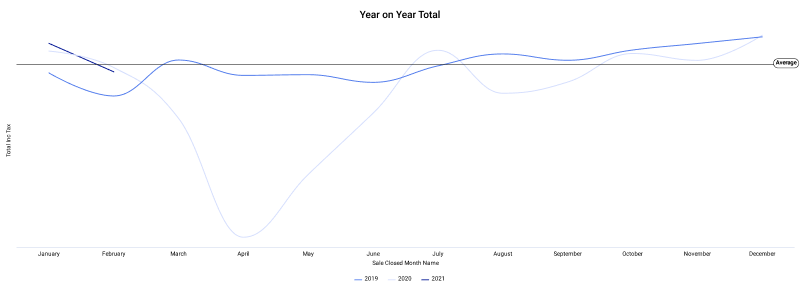
The graph above includes all venue types (i.e. cafes, restaurants, bars, etc.) across all states in Australia and Auckland (NZ)
With the core service (dining in) unavailable for most venues, other sources of revenue were explored.
Menus were stripped, delivery & takeaway were implemented, merchandising and cook at home meals were explored – a chef in Melbourne even started a cooking masterclass as a source of revenue.
In an industry this innovative, there was clearly no shortage of creative alternatives.
Integrated orders: delivery, takeaway & in-app table ordering
As an industry, we were all very familiar with the limitations of integrated orders: commission was a big cost, it burdened the back of house, and it was a strain to day-to-day workflows.
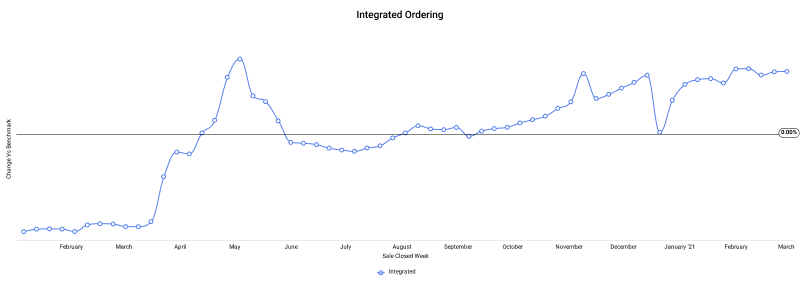 The graph above plots out the increase/decrease in integrated orders when compared to the month before
There were a lot of reasons to not offer integrated ordering until the lockdown and its subsequent restrictions.
Which is what the graph demonstrates: a distinct correlation between the lockdown (April & May 2020) and the spike in integrated orders.
Integrated orders continue to grow despite the ease of restrictions
After the initial spike in April/May 2020, integrated orders did not plateau to pre-COVID levels. Instead, after an initial dip in mid 2020, they began trending up again.
It would be premature to ascertain the degree of impact integrated orders will have on the industry in the years to come; but based on the data, we can see with certainty that integrated orders are a growing channel – pandemic or no pandemic.
The industry as a whole (both consumers and businesses) is adopting and gradually weaving integrated orders into their day-to-day – from delivery & order ahead, to dine-in orders from a table ordering app.
Sales by Business Types (Bar vs Restaurant vs Cafe)
In this section, we deep dive into different business types, impact on their revenue, and the duration it took for the respective venues to recover.
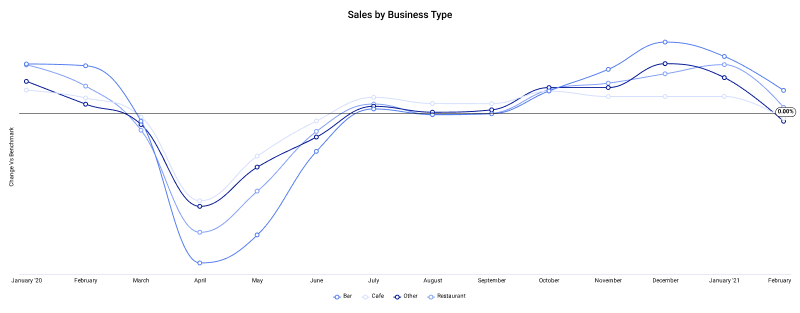 The graph above compares revenue for different business types (bar, cafe, other, restaurant) based on their monthly average
There is a clear relationship between the level of impact on revenue and the recovery period.
- Bars average monthly revenue dropped the most – it took a period of 7 months to return to pre-COVID revenue.
- Restaurants were the second most impacted business type – it took a period of 6 months to return to pre-COVID revenue.
- Cafes took a big dip from their monthly average revenue but were the least impacted when compared to bars and restaurants. They returned to pre-COVID revenue within 4 months.
Revenue percentage per business type
The table below displays the precise percentage increase/decrease in revenue for each business type (across Australia and Auckland, NZ) when compared to their average monthly revenue.

April 2020, peak lockdown, saw a consistent drop in revenue across all business types.
Bars and restaurants made 86.83% and 73.95% below their average monthly revenue, respectively; cafes made 55.40% below their monthly average.
Bars
- Revenue was most impacted in April 2020 – sales were 86.83% below average
- October 2020 was the first month (after April 2020) where revenue surpassed the average month by 16.86%
- Most profitable month was December 2020 – sales were 52.49% above average
Restaurants
- Revenue was most impacted in April 2020 – sales were 73.95% below average
- September 2020 was the first month (after April 2020) where revenue was above the average month by 1.05% – this grew to 18.07% above average within a month in October 2020
- Most profitable month was January 2021 – sales were 50.26% above average
Cafes
- Revenue was most impacted in April 2020 – sales were 55.40% below average
- July 2020 was the first month (after April 2020) where revenue was above the average month by 5.92%
- Most profitable month was January 2021 – sales were 23.70% above average
Lightspeed customer? What does your table look like?
Get an instant view of your 2020 sales data and performance in this free dashboard.
Sales by Cities (across Australia and Auckland, NZ)
In this section, we observe the varying degree of impact state restrictions had on cities across Australia and Auckland, New Zealand.
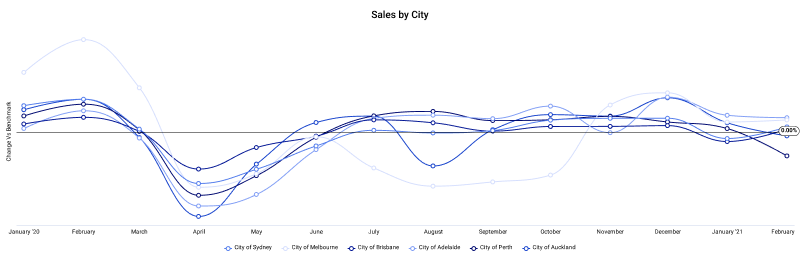
The graph above groups venues by postcodes to compare the impact of COVID-19 on major cities.
The revenue earned by venues closely parallels the condition and restrictions of their city.
Melbourne’s longer period of lockdown shows an impact in revenue from April 2020 till October 2020; while Auckland’s strict lockdown shows the greatest dip in revenue but also the quickest recovery.
Revenue percentage per city
The table below displays the precise percentage increase/decrease for venues of all business types in each city (across Australia and Auckland, NZ) when compared to their average monthly revenue.
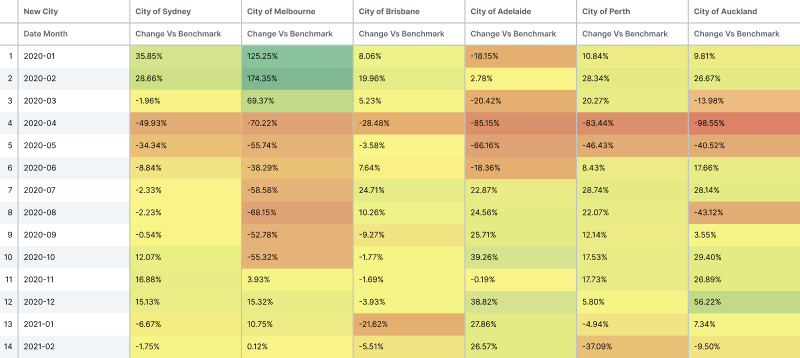
While April 2020 was the month of greatest impact for all hospitality venues across major cities, the percentage drop in revenue, along with the recovery time varies drastically.
Sydney
- Venues in Sydney made 49.93% lesser than their average monthly revenue in April 2020
- It took venues 7 months to return to pre-COVID revenue
- November 2020 was the most profitable month post-pandemic, with a 16.88% increase in average monthly sales
Melbourne
- Venues in Melbourne made 70.22% lesser than their average monthly revenue in April 2020
- August 2020 was equally impacted with the second lockdown, venues made 68.15% less than their average monthly revenue
- It took venues 7 months to return to pre-COVID revenue
- December 2020 was the most profitable month post-pandemic, with a 15.32% increase in average monthly sales
Brisbane
- Venues in Brisbane made 28.48% lesser than their average monthly revenue in April 2020
- It took venues 2 months to return to pre-COVID revenue
- July 2020 was the most profitable month post-pandemic, with a 24.71% increase in average monthly sales
Adelaide
- Venues in Adelaide made 85.15% lesser than their average monthly revenue in April 2020
- It took venues 4 months to return to pre-COVID revenue
- October 2020 was the most profitable month post-pandemic, with a 39.26% increase in average monthly sales
Perth
- Venues in Perth made 83.44% lesser than their average monthly revenue in April 2020
- It took venues 2 months to return to pre-COVID revenue
- July 2020 was the most profitable month post-pandemic, with a 28.74% increase in average monthly sales
- February 2021 saw a 37.09% decrease in sales due to the second lockdown
Auckland (NZ)
- Venues in Auckland made 98.55% lesser than their average monthly revenue in April 2020
- It took venues 3 months to return to pre-COVID revenue
- Venues were impacted in August 2021 by the second lockdown and experienced a 43.12% decrease in average monthly sales
- December 2020 was the most profitable month post-pandemic, with a 56.22% increase in average monthly sales
How did your business perform?
This whitepaper shares the story of the industry through one of the most tumultuous years. But every business has their own version of the year – their unique experiences, challenges, and numbers.
If you’re a Lightspeed customer, you can unpack your data in your Insights Lite Dashboard. Understand how your business performed in 2020 and the steps that you can take in 2021.
View your Insights Lite Dashboard
Unpack for 2020 data in your business Dashboard, available for free to all Lightspeed customers.

News you care about. Tips you can use.
Everything your business needs to grow, delivered straight to your inbox.