
If you own or operate a restaurant, you have to take on many roles. There’s the creative side of running a restaurant, which involves creating a concept, developing a menu, and marketing the business. There are also administrative tasks that, while less thrilling, are critical to the success of the restaurant.
One of these important tasks is keeping track of the business’ finances. As the person who manages the books and monitors profit and loss, you have to make sure that your restaurant has enough money to stay afloat.
This goal can seem lofty when you first open a restaurant, since it may be a long time before you get out of the red and start seeing profits.
You don’t need a business school degree to manage your restaurant’s finances, but you’ll most likely need to learn some new concepts to understand how money comes into and goes out of your business in order to make smart business decisions. One critical key performance metric you should track is your break even point.
In this post, you’ll learn:
- What is a break even point?
- Why is it important to know your break even point?
- How to calculate your restaurant’s break even point
- What is the break even point formula?
- What is break even analysis?
- What are the limitations of break even analysis?
- Create a path to profitability with a restaurant break even analysis
Let’s dive in!
Our free Opening a Hospitality Venue: 9 step Survival Guide can help you get off on the right foot.Thinking of opening a venue?
What is a break even point?
A break even point is the point at which your restaurant’s revenue balances out its spending. This is the point at which your business has as much debt as it has profits. It’s when you have a net profit of $0.
Break even point can be calculated in one of two ways: in dollars and in units.
When you calculate your break even point in terms of dollars, you’re trying to find out how much revenue your restaurant will need to generate to end with a $0 balance at the end of a certain period of time.
When you calculate your break even point in terms of units, you’re learning how many pizzas, coffees, drinks, etc. you’ll need to sell to achieve that same goal.
Why is it important to know your break even point?
Your ultimate financial goal for your business should be to make a profit, and calculating your break even point can help you get there.
When you know your break even point, you understand how many sales you need to generate in order to no longer be in debt. When you have sales targets, you can break them down into realistic mini goals or milestones, which are easier to achieve.
Example
Let’s say that your break even point is $700,000. That’s an intimidating figure that may seem out of reach to you today. You decide that you want to give yourself a year to break even. You divide your break event point by 12 months and learn that your business will need to generate $58,300 in revenue each month to meet that deadline. This goal seems much more manageable than the original one.
It’s easy to get caught up in the day to day operations of restuarateurship and forgo making goals that can move the needle forward in a big way. Knowing your break even point can help you set short-term goals that help you achieve your long-term business goals.
How to calculate your restaurant’s break even point
Before you learn the break even analysis formula, you need to calculate all of your restaurant’s expenses.
This exercise can be tricky because some restaurant costs are the same every month (a.k.a. fixed costs), some always vary (variable costs), and others are a mix of both (mixed costs).
Here’s a list of fixed costs, variable costs, and mixed costs to consider before you calculate your break even point. You’ll notice figures next to each cost below. These are hypothetical numbers that we will use in our upcoming break even analysis example.
Fixed costs
Fixed costs stay the same from month to month. These are estimated figures, but they include:
- Rent/mortgage payment – $8000/month
- Professional services – marketing, accounting, legal, etc. – $1000/month
- Insurance premiums – $500/month
- Licences – tech subscription for point of sale system, a restaurant reservations management tool, etc. – $300/month
Variable costs
As the name implies, variable costs change over time and typically depend on use. They include but aren’t limited to:
- Utilities – water, electric, phone, etc. vary and tend to be based on use – $1000/month on average
- Unexpected expenses – repairs, new equipment, etc. – $1000/month on average
- Inventory – vendor prices fluctuate, as do your restaurant’s needs depending on demand, menu, and seasonality – $8,000/month on average
Mixed costs
Mixed costs feature both a fixed and a variable component. The biggest mixed cost expense is:
- Labour – Salaries are typically fixed and predictable. Hourly workers’ wages vary depending on their hourly rate, how much they work and overtime. – $27,000/month on average.
For some useful tips on lowering your staffing costs, we recommend reading our Guide To Reducing Hospitality Staffing Costs where we take a deeper look at the ways you can lower your wage bill without sacrificing service.
What is the break even point formula?
There are two ways to calculate your restaurant’s break even point: in units and in dollars. We’ll break down both break even analysis formulas and illustrate how to use them with relevant examples.
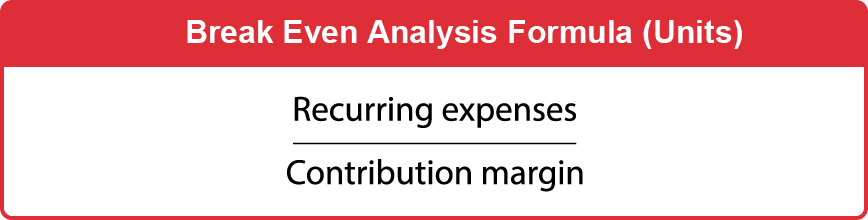
Break even analysis formula in units
Let’s say that Papa G just opened Papa G’s Pizza. He invested all of his savings into his restaurant’s startup costs and wants to know how many pizzas he needs to sell in order to break even and recoup the investment.
So in this scenario, we are solving for the number of pizzas. In order to discover how many pizzas Papa G needs to sell in order to break even, we need to divide his recurring expenses by his contribution margin.
How to calculate recurring expenses
Recurring expenses = Sum of all expenses
First, we need to figure out his recurring expenses. This is where the exercise in the last section came in handy. See all of those numbers we put next to the expenses? They’re hypothetical figures that we created to help us with this calculation.
If we add up the expenses in all of the categories, we get around $560,000. Those are the restaurant’s hypothetical recurring monthly expenses, so we have:
BEP = $560,000 / Contribution margin
How to calculate contribution margin
Contribution margin = Revenue per unit – Expenses per unit
To find out Papa G’s contribution margin, we need to calculate two figures: revenue per unit and cost of goods sold (COGS) per unit.
Revenue per unit is simply how much you charge for one item. Papa G charges, on average, $20 per pizza pie. Therefore, his revenue per unit is $20.
COGS per unit are how much it costs you to make one item. Papa G thinks about all of the ingredients that go into his pizzas (flour, yeast, oil, cheese, sauce, toppings, etc.) and calculates that it costs him $4, on average, to make one pizza. So his COGS per unit are $4.
Papa G’s contribution margin then is $20-$4, or $16.
When we plug this figure back into the original break even point formula we get:
BEP (unit) = Recurring expenses / Contribution margin
BEP (unit) = $560,000 / $16
BEP (unit) = 35,000 pizzas
Papa G needs to sell 35,000 pizzas in order to break even. They’re not quite Dominos numbers, but it’s still a lot of pizza. Papa needs to get to work.
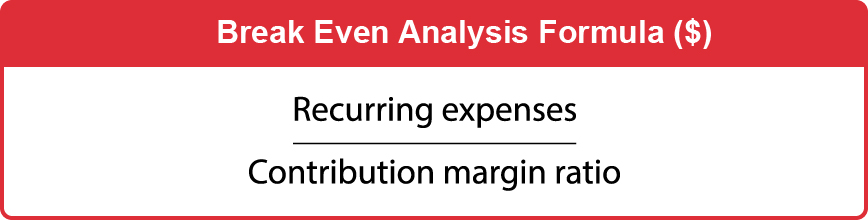
Break even point formula in sales dollars
Now we’ll show you how to calculate break even point in sales dollars instead of units.
We’ll continue to illustrate using Papa G’s Pizza shop as an example because it’s a long-standing pipedream of mine. Papa now wants to know how much revenue he needs to generate in order to break even. First, he needs to calculate his recurring expenses.
How to calculate recurring expenses
Recurring expenses = Sum of all expenses
Just like in our last calculation, we calculate recurring expenses by adding up all of the restaurant’s monthly expenses.
After he adds up his fixed, variable, and mixed costs, Papa G’s recurring expenses remain at around $560,000.
BEP = $560,000 / Contribution margin ratio
Now we must calculate the contribution margin ratio.
How to calculate contribution margin ratio
A contribution margin ratio is the difference between Papa G’s sales, and his variable expenses, and it’s expressed as a percentage which means we have to return to everyone’s best friend, maths. Yay!
Contribution margin ratio = Contribution margin / Revenue per unit
To calculate profit margin ratio, take your contribution margin from the per unit calculation (revenue per unit – expenses per unit) then divide it by revenue per unit. This will result in a percentage.
Pete’s contribution margin is $16, because it costs him $4 to make a pizza pie that he sells for $20.
Pete’s revenue per unit, on average, is $20.
Contribution margin ratio = Contribution margin / Revenue per unit
To calculate profit margin ratio, take your contribution margin from the per unit calculation (revenue per unit – COGS per unit) then divide it by revenue per unit. This will result in a percentage.
Papa G’s contribution margin is $16, because it costs him $4 to make a pizza pie that he sells for $20.
Papa G’s revenue per unit, on average, is $20.
So to calculate the contribution margin ratio we plug in these figures…
Contribution margin ratio = $16 / $20
Contribution margin ratio = 0.8
Contribution margin ratio = 80%
… and discover that Papa G’s contribution margin ratio is 80%.
Now we can go back to the original break even analysis formula and plug in the recurring expenses and contribution margin ratio to discover the break even point in dollars:
Break even point in dollars (BEP) = Recurring expenses / Contribution margin ratio
BEP = $560,000 / 80% = $700,000
Papa G will break even when he generates $700,000 in sales.
What is break even analysis?
In a nutshell, break even analysis is the practice of calculating your break even point. As we mentioned, knowing your business’ break even point can help you set realistic business goals. When goals are realistic, there’s a greater chance that they’ll be met and analysing your break even point is a sure-fire way of ensuring your goals are as achievable and realistic as possible.
Units
So let’s see how Papa G of Papa G’s Pizza can use his restaurant break even analysis to set sales targets for his shop.
We discovered that Papa needs to sell 35,000 pizzas to break even. This figure can seem out of reach until you set a deadline. Papa G wants to break even within two years. To learn how many pizzas he needs to sell each month to achieve this goal, he divides units (35,000) by the number of months (24) and gets a goal of 1,458 pizzas sold each month.
He breaks this goal even further into daily targets to help motivate his team to make sales. He divides his monthly goal (1,458) by days in a month (30) and learns that he and his team need to sell 48 pizzas every day in order for the business to break even in two years.
Dollars
Papa G can set similar targets from his dollar-based break even point. Why make essentially the same calculation twice? Because the break even points are based on average margins and revenue, and actual margins and revenue will vary per unit (a small pepperoni won’t cost the same as a large supreme), it’s useful for Papa G to do both calculations to estimate how many pizzas or how much revenue he must generate to break even.
Based on our earlier calculation, Papa G needs to make $700,000 in sales to reach an equilibrium between his profits and losses. That’s an intimidating number!
His goal remains the same, however: break even within two years. To calculate his monthly sales target he divides the break even point ($700,000) by months (24) and gets a goal of $29,167 per month. This comes out to a daily target of $972.
In order for Pete’s Pizza to break even, it needs to generate approximately $972 in revenue or sell 48 pizzas every day for two years.
Not so intimidating anymore, is it?
What are the limitations of a break even analysis?
As with most things, there are limitations and break even analysis isn’t immune here.
The major limitation is humans themselves.
We don’t all follow the same routine, day in, day out (although some of us get mighty close), and this means that the numbers will fluctuate. This isn’t a bad thing though because for every shift where trade was slow, you can bet there’ll be another shift (probably when you’re under-staffed and unprepared) where you’re run off your feet.
3 Tips to lower the break even point
If, after all the break even analysis in the world, your goals still don’t seem achievable or realistic, you can rest assured that all hope is not lost. That’s because a lot of these figures are still under your control. A few little tweaks here and there might not seem like a huge difference in your day-to-day figures, but calculated over that 2 year period will add up and pay dividends.
1.Lower your COGS
The first place to start would be your COGS. Lowering your COGS by means of shopping around for the cheapest suppliers, streamlining your prep time, or even creating ingredients from scratch will yield a larger contribution margin ratio, which means more of the $20 taken per pizza goes towards achieving Papa G’s BEP, rather than the ingredients.
2.Raise your prices (slightly)
Another way to lower Papa G’s BEP is to simply raise the prices. I know this can be a little tricky to pull off and it has the potential to cause some unrest within the customer base, but even adding an extra dollar onto the average cost of a pizza will make a huge difference.
Over 2 years, it equates to an extra $35,000 which I think is worth the risk.
3.Implement a surcharge
You could also consider implementing a surcharge on Sundays and public holidays. This would raise your revenue per unit by 10% at least one day each week, helping you reach your BEP even sooner. Plus, everyone does it so the customers are less likely to push back (although there are always a few).
Create a path to profitability with a restaurant break even analysis
Starting a restaurant is a money-intensive feat. The sooner you can get out of debt, the more likely your restaurant will be to stay afloat for the long haul.
When you know what is a break even analysis and are able to conduct and implement it strategically, you can gain insights into your business that can help you make smarter decisions and reach profitability sooner.

News you care about. Tips you can use.
Everything your business needs to grow, delivered straight to your inbox.